
 Help always available here :-
Nutritional evaluations
Help always available here :-
Nutritional evaluations
Nutritional evaluations, i.e. assessing the content of various nutrients and comparing it to a predefined standard "allowance", can be carried out on:
Regardless of which of the three is used the resulting evaluation picture looks similar to this below:
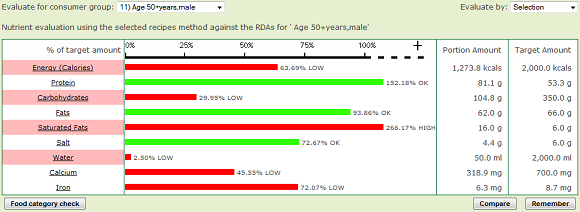
Let's examine this display and see what it is showing to us.
At the top is the "Evaluate for consumer group" drop-down list. This selects the set of standard allowances you want to use for comparison. There are a number of these preset in the system covering a range of ages and genders and based on government guidelines. You can use these or set up your own if you wish (see the tutorial topic on Allowances for more detail).
The "Evaluate by" drop-down list is applicable only to evaluations carried out on menus. The Selection method evaluates specific choices from the menu determined by ticks in the "Selection" column on the Recipes tab of the menu details page. The Portion Average method calculates an average based on predicted consumption by a large population of each choice on the menu. Further explanation of these is included in the on-line help for the menu details page.
In the middle is where each selected nutrient (you select which nutrients you want to see via your preferences, which you get to using the Account / My Preferences option) is shown along with the calculated amount of that nutrient in one portion of the recipe or menu, or in one day of a time-span of menus, depending on what you are evaluating.
At the right hand side are the numerical values - the Portion Amount column is the calculated amount in one portion or on one day. The Target Amount is the value taken from the selected consumer group allowances.
The bar chart in the centre reflects the Portion Amount as a percentage of the Target Amount, hence for Salt, 4.4g is 72.67% of 6g.
Only trained nutritionists or dieticians would need to be concerned with the actual detailed values but for the caterer the bar chart gives a quick view of whether or not the recipe or menu is providing a balance of nutrition.
In the above example, protein and saturated fat are shown as exceeding 100% of the selected daily allowance, which may be a cause for concern and require some thought to adjust the menu to bring it more into balance.
However, the protein bar is shown in green whereas the saturated fat is shown in red. This is because an excess of protein in not necessarily a bad thing (unless there is an underlying medical condition in the consumer) whereas an excess of saturated fat is always undesirable.
For some nutrients the guideline is to consume AT LEAST that amount whereas for others it is to consume NO MORE than that amount. The colours of the bars reflect those differences.
One the next page we'll look at the ability to "drill down" into a problem nutrient to find out what is causing the excess. We'll also look at the Compare and Remember buttons.
|
|
|

