
 Help always available here :-
Menu detail - Evaluation tab
Help always available here :-
Menu detail - Evaluation tab
The evaluation tab of the menu details page displays information about the nutritional content of the menu. The evaluation can be based on one individual's choices from the menu or be based on an overall average across a population of consumers.
Full details of how to interpret the information displayed in this section are provided in a dedicated tutorial topic, Nutritional Evaluations, since it is relevant to the evaluation of recipes and to menus. However, this topic will discuss the relevance of an evaluation of a menu.
When evaluating a menu it is important to think about what you are evaluating. For example, a menu you design could contain 3 starters, 4 main course choices and a choice of 2 desserts. Clearly you can't simply lump that lot together, add it all up and present that as a realistic nutritional consumption for a person.
The system provides two methods of evaluation that attempts to work around this problem.
This method uses the "Selection" tick boxes on the Recipes tab to identify the choices that an individual might make from the menu. An individual may choose a starter, a main and a dessert. By ticking only those recipes on the Recipes tab and clicking Save, the system can then display an evaluation based only on those choices.
Where a menu is being server to a population of consumers, in a school for example, it is not possible to carry out an evaluation of every individual's choices. In this case the caterer must attempt to predict what the likely spread of choices will be across the population.
For example, say that there are 100 consumers and the caterer predicts that 25 will take starter number 1, 40 will take number 2 and 35 will take number 3. Similar predictions can be made for the mains and the desserts. These predictions are entered into the Reqd Portions boxes on the Recipes tab and the size of the population (100) is entered into the "Number of Covers" box, also on the Recipes tab. The system is then able to calculate a realistic average consumption for the whole population and produce a nutritional evaluation for it.
This may sound a bit complicated, and it is, but that is the way that the schools food regulations (2013) have to be worked.
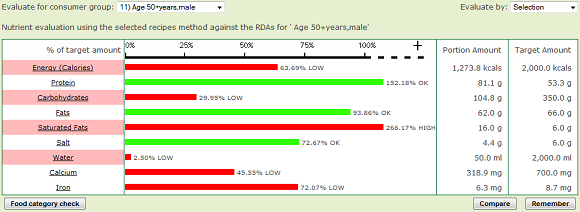
What the chart in the evaluation shows is where the offered menu might be inadequate in some nutrient.
Saturated fats, for example, can sometimes be present in large amounts in a menu, especially where butter, cheese or cream are part of the recipes. The amount of salt can also be something to monitor.
The chart provides a means of quickly assessing the nutritional content of a menu to detect any areas that may be a concern so that some corrective action can be taken, such as offering an alternate recipe to reduce the amount of the problem nutrient.
To help identify which recipe may be causing an excess of a nutrient, you can click on the nutrient name, Saturated Fats for example in the example above, and the system will then "drill down" into each recipe and display a breakdown showing the amount of the nutrient being contributed by each one.
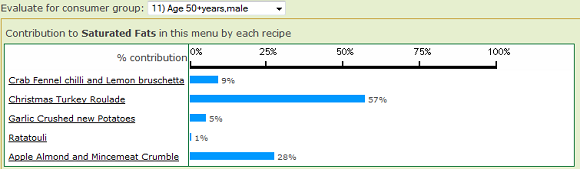
Here, for example, we have clicked on Saturated Fats and the system is showing us that the majority of the saturated fat in the recipe is contributed by the Christmas Turkey Roulade.
You will notice that the evaluation has been made for a particular "consumer group" (Age 50+ male in this case). The meaning of this is fully described in the dedicated nutritional evaluation topic.
As previously mentioned, the evaluation of a menu helps to identify where nutritional "problems" may be present in the offered recipes so that they can be addressed.
|
|
|

